


A dividend calculator can turn an assumed annual dividend yield into a dollar estimate, and show how reinvesting compares with keeping the cash. You supply the yield, amount, years and payment frequency. The result is only as good as that assumption: it is arithmetic, not what any real stock will pay.
With a hypothetical $10,000 investment and 4% annual dividend yield, the starting estimate is $400 a year, or about $33.33 a month on average, before taxes and fees and without reinvesting. If the dividend is paid in four equal quarterly installments, that is initially $100 per payment, not a $33.33 payment every month.
The calculator below also compares reinvesting those dividends with keeping them as cash. It is a simplified arithmetic model, not a stock recommendation, income guarantee, or prediction of market returns. The 4% example is an assumption, not a current market average or suggested target.
How do you use the dividend calculator?
Enter your starting investment amount, an assumed annual dividend yield, the number of whole years, and the payment frequency. Enter 4 for 4%, not 0.04.
Dividend calculator
Compare reinvested dividends (DRIP) with keeping all dividends as cash. All amounts are in USD.
This calculator runs only in your browser. This plugin does not send, save, or track your entries.
Assumptions and limits
- No monthly or other additional contributions are supported.
- Share price and dividend per share stay constant. Dividends are equal and paid at each period end, with immediate reinvestment at the same price into fractional shares.
- The cash comparison retains all dividends at zero interest and holds the original shares at their unchanged value.
- No price growth, taxes, fees, inflation, dividend changes, or investment risk are modeled. Real dividends can change or stop, and share prices can fall.
- DRIP holdings are a nominal constant-price illustration, not a future price prediction or investment advice. Displayed USD amounts are rounded to cents; calculations use unrounded values.
Formula check: D = P × (1 + y/f)^(f × t). Cash dividends = P × y × t. Cash plus unchanged shares = P + cash dividends. DRIP dividends reinvested = D − P, already included in D. Final difference = D − (P + cash dividends). Here y = annual yield / 100.
Scope: This version has no extra contributions or withdrawals. It holds the share price and dividend per share constant, assumes equal payments and immediate reinvestment into fractional shares, and leaves out taxes, fees, inflation, and interest on retained cash.
Payment frequency is an assumption, not a live dividend calendar. A smooth rising result comes from these assumptions, not a promise that a real investment will behave that way.
How the calculator handles inputs and rounding
Use the example button to reproduce the numbers in this guide. The tool calculates locally in your browser without sending or saving your entries.
The calculator carries unrounded values between periods and rounds currency for display.
What do the annual, monthly, and per-payment numbers mean?
For a position you already own, one direct starting estimate is shares owned × assumed annual dividend per share. For example, 100 shares paying an assumed $4 per share over a year would produce $400 before taxes. If those shares are priced at $100 each, the position is worth $10,000 and its dividend yield is $4 ÷ $100 = 4%.
FINRA defines stock yield using the year’s dividend divided by the stock’s market price. Use a matching price and dividend basis. A yield quoted at today’s price is not necessarily the yield on the amount you originally paid. A trailing yield describes past distributions; a forward estimate assumes future payments that can change.
Inputs (hypothetical): a $10,000 starting amount, a 4% assumed annual dividend yield, and four equal payments a year, with no reinvestment.
- Starting annual estimate: $10,000 × 0.04 = $400, without reinvestment.
- Monthly average: $400 ÷ 12 ≈ $33.33. This is a budgeting conversion, not a payment schedule.
- Initial quarterly payment: $400 ÷ 4 = $100, assuming four equal payments.
What to check: the issuer’s announced amount, eligibility dates, and payment dates before expecting cash. FINRA’s guidance on estimated income notes that changes in payment amount or frequency change actual income. Do not treat an annualized estimate as money already received.
How should you compare reinvesting with keeping the cash?
A dividend reinvestment plan, or DRIP, uses a dividend to buy more shares rather than paying it out as spendable cash. In this model, the first $100 quarterly dividend buys additional shares at the unchanged price. The next quarterly dividend becomes $101. Reinvestment makes the first year’s four payments total about $406.04, rather than the $400 received without reinvestment.
At ten years, the example produces $14,888.64 in reinvested holdings. Without reinvestment, the original shares are still valued at $10,000 under the constant-price assumption, and the investor has retained $4,000 in dividends: $14,000 combined.
The modeled difference is $888.64, not $4,888.64. Comparing the DRIP balance only with the original $10,000 would unfairly ignore the other investor’s cash.
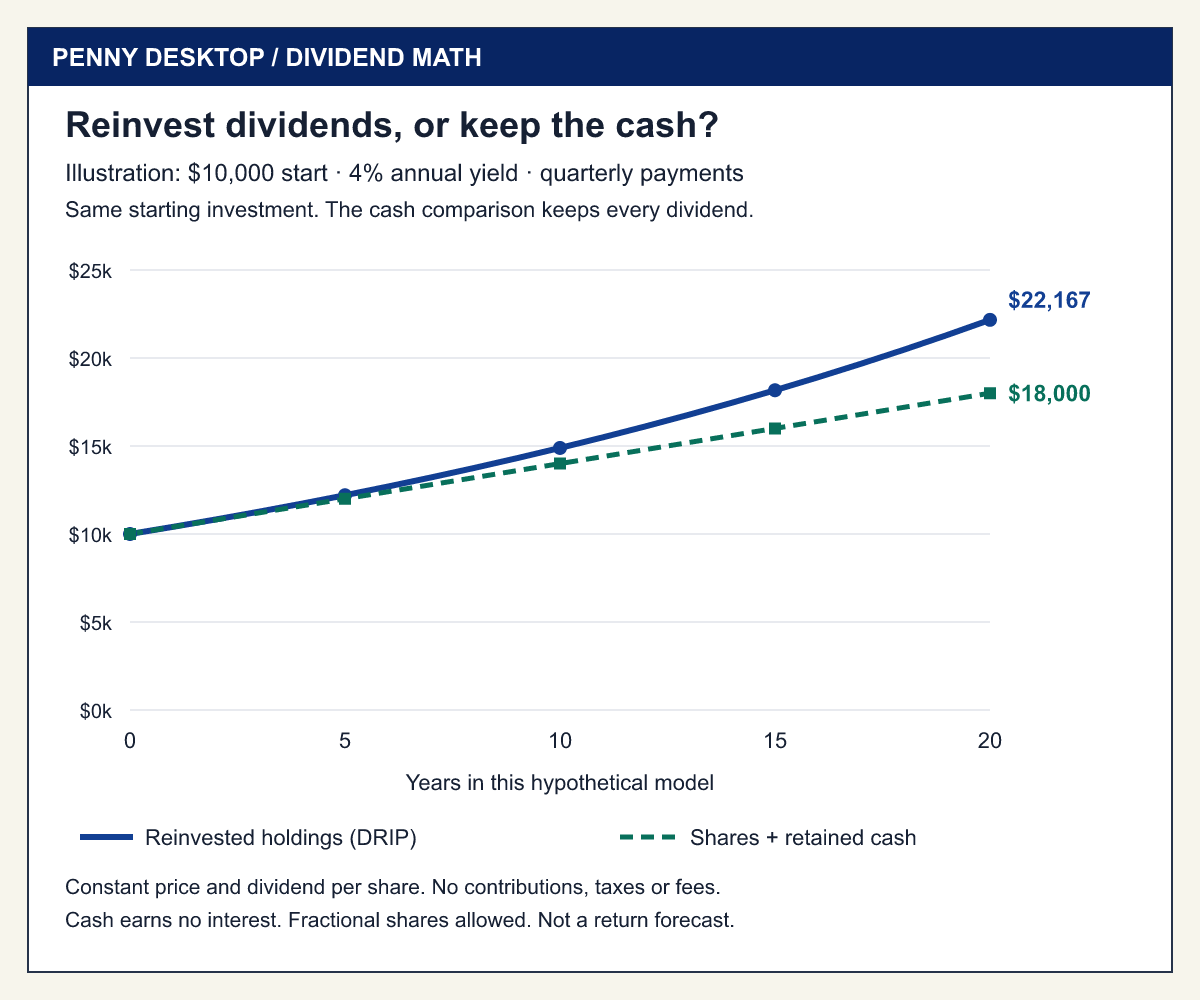
| Years | Cash dividends retained | Shares + retained cash | Reinvested holdings |
|---|---|---|---|
| 1 | $400.00 | $10,400.00 | $10,406.04 |
| 5 | $2,000.00 | $12,000.00 | $12,201.90 |
| 10 | $4,000.00 | $14,000.00 | $14,888.64 |
| 20 | $8,000.00 | $18,000.00 | $22,167.15 |
Keeping cash is not automatically the wrong choice. Someone may need the distributions for spending, and actual reinvestment prices can rise or fall. This comparison assumes the cash is neither spent nor invested elsewhere. It does not compare DRIP with another investment strategy or account for its risks.
What formulas does the calculator use?
Let P be the starting amount, r the annual dividend yield as a decimal, f the number of equal payments per year, and t the years:
- Starting annual dividend estimate: P × r.
- Shares plus retained cash, without reinvestment: P + P × r × t.
- Reinvested holdings in this constant-price model: P × (1 + r ÷ f)f × t.
The reinvested balance already includes the shares bought with earlier dividends; do not add those dividends a second time. Real share prices, dividend amounts, reinvestment dates, fractional-share policies, and costs will not necessarily match this model.
Is a higher dividend yield a better return?
A lower share price can make a quoted dividend yield rise even when the dividend per share has not increased. For example, an unchanged $4 annual dividend divided by a $50 share price is 8%, versus 4% at $100. That larger percentage does not erase the price decline.
FINRA distinguishes investment return, including changes in value and income, from yield. It also explains that common-stock dividends can be reduced or stopped and stock investments can lose value. A calculator that holds prices steady cannot measure those risks. Try a lower yield to examine sensitivity, but do not treat that as a complete downside test.
Does reinvesting avoid tax on the dividends?
For ordinary taxable-account investments, IRS Publication 550 (2025), “Dividends Used To Buy More Stock,” says dividends used to buy shares at fair market value still need to be reported as income. The publication separately excludes investments held in IRAs, 401(k) plans, and other qualified retirement plans from its general rules. Those accounts require their own treatment.
This calculator has no tax-rate input and does not calculate qualified-dividend treatment, withholding, or after-tax income. Do not assume its displayed amount is spendable after tax. Check the rules for your account and circumstances; get qualified tax help when needed.
Can you use the result in a monthly budget?
Write down where the dividend assumption came from, whether it is historical or forward-looking, and when the company actually pays. Keep a cash need separate from a projected investment distribution. Our essential-expense checklist can help identify the bills that need available cash, while the monthly savings-interest guide covers a different calculation for bank savings.
Use this page to understand the math, not to select a stock or decide how much risk to take. It does not model preferred-stock terms, fund distributions that include return of capital, stock dividends paid as shares, or a portfolio of changing holdings.
When does this calculator not fit?
- You need after-tax or account-specific figures. There is no tax-rate input, and retirement accounts follow their own rules.
- You add money or withdraw along the way. This version has no contributions or withdrawals and holds prices constant.
- The holding is not a single common stock. Preferred-stock terms, fund distributions that include return of capital, stock dividends paid as shares, and changing portfolios are not modeled.
- You are choosing an investment or judging risk. The model cannot show price declines or dividend cuts, so it cannot compare investments.
Quick decision checklist
- Note where your yield assumption comes from and whether it is trailing or forward-looking.
- Match the yield to the same price and dividend basis before entering it.
- Check the issuer’s announced amount and payment dates before counting on any cash.
- Compare DRIP with shares plus retained cash, not with the starting amount alone.
- Check the tax rules for your account type; reinvested dividends in a taxable account are still reported as income.
Sources and review notes
- FINRA, Stocks: dividends, DRIPs, and stock-investing risks
- FINRA, Evaluating Performance: yield and return
- FINRA, Regulatory Notice 08-77, December 12, 2008: estimated income and payment-frequency limitations
- IRS, Publication 550, Investment Income and Expenses, 2025 edition
Source pages and illustrative arithmetic checked on September 24, 2026 (UTC; September 25 in Korea). Prepared with AI-assisted research, drafting, and calculation checks, not an independent human or professional review. Examples are hypothetical and no return is promised. Read our editorial policy or report a correction.

